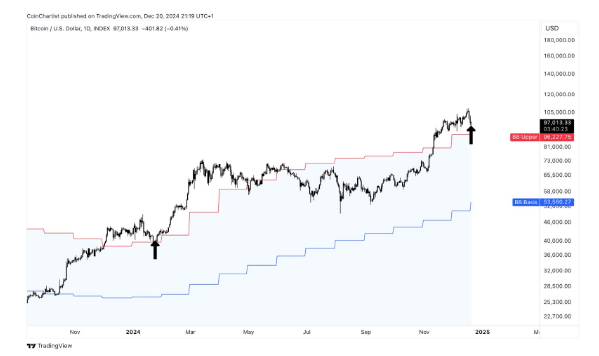
In his recent report, Charles Edward, a prominent crypto market analyst, released an update on the state of the Bitcoin (BTC) market. The report highlights the continuation of the downtrend for Bitcoin, which has been losing its key support, the 50-day Moving Average (MA).
The bearish trend has been confirmed by technical indicators and the pure fundamental Bitcoin Macro Index algorithm, which has seen an increasing rate of contraction over the last week.
Is Bitcoin Headed For $25,000?
The report provides insights into both high and low timeframe technicals, with the next support levels for Bitcoin at $28,000, $24,000, and low-$20,000, each offering better relative opportunities.
The low timeframe technicals indicate a breakdown in support at $30,000 and the emergence of a new bearish trend, with a target of circa $25,000.
The Capriole Bitcoin Macro Index, which combines over 40 of the most powerful Bitcoin on-chain, macro market, and equities metrics into a single machine learning model, suggests a decent long-term value for multi-year horizon investors, but with decreasing fundamentals over the last week.
On the other hand, the Three Factor Model, a new open-source algorithm, values the S&P500 using three fundamental data points only, indicating that the markets are fairly valued today, with room for more upside, despite recent bearish signals.
Despite the bearish outlook, the report suggests that the macroeconomic backdrop remains favorable for Bitcoin over the coming years.
The Federal Reserve has paused rate hikes, and the S&P500 has had its longest winning streak in years. However, the technicals and fundamentals are currently showing a “not yet” signal, indicating that the market may need to wait for a positive trigger such as the approval of the Blackrock ETF.
Overall, the report suggests a long-term bullish outlook for Bitcoin, but with caution in the short term until technicals or fundamentals prove otherwise.
According to Edwards, the nearest points of technical opportunity are $28,000, $25,000, and $21,000, or a daily close back into the $30,000 range.
Low Volatility, High Potential
Bitcoin’s price volatility has been at historic lows, with the cryptocurrency experiencing its second-lowest level of yearly volatility ever. This fact has been noted by many in the crypto community, including Crypto Con, who points out that historically, low volatility has been a bullish sign for Bitcoin.
Low volatility can be seen as a sign of stability and maturity for a cryptocurrency. It suggests that the market is becoming more efficient and that there is less speculation driving prices up and down. This can be a positive sign for long-term investors, as it suggests that cryptocurrency is becoming more reliable as a store of value.
Moreover, Bitcoin has historically performed well after periods of low volatility. Every time Bitcoin’s volatility has dropped to similar levels in the past, it has been followed by a significant price increase.
This suggests that, while the current low volatility may be frustrating for traders looking for quick profits, it could be a positive sign for long-term investors.
In conclusion, while the current low volatility in Bitcoin’s price may not be exciting for traders, it could be a positive sign for long-term investors. Historically, low volatility has been a bullish sign for Bitcoin, and the cryptocurrency’s current stability comes at a time when several positive macroeconomic factors could drive its price up in the future.
As of the time of writing, Bitcoin has lost its crucial support line of $29,000 and is currently trading at $28,900, representing a decline of over 1% in the last 24 hours.
Featured image from Unsplash, chart from TradingView.com
Credit: Source link


