In recent trading sessions, Chainlink (LINK) has exhibited a bullish trend. It experienced a significant rebound from its $5 support level and has since continued on an upward trajectory.
Over the past week, LINK has surged more than 12%, although its daily chart indicates a slowdown in gains. The coin formed a bullish reversal pattern, driving a substantial price surge.
The technical outlook for LINK reflects bullish strength, albeit with a slight decline in demand and accumulation on the chart. In recent trading sessions, LINK has formed a pattern that suggests a potential reversal in price direction.
To prevent this reversal, it is crucial for LINK to maintain its upward movement and surpass immediate resistance levels. Additionally, a slight decline in market capitalization indicates a decrease in buying strength.
Chainlink Price Analysis: One-Day Chart
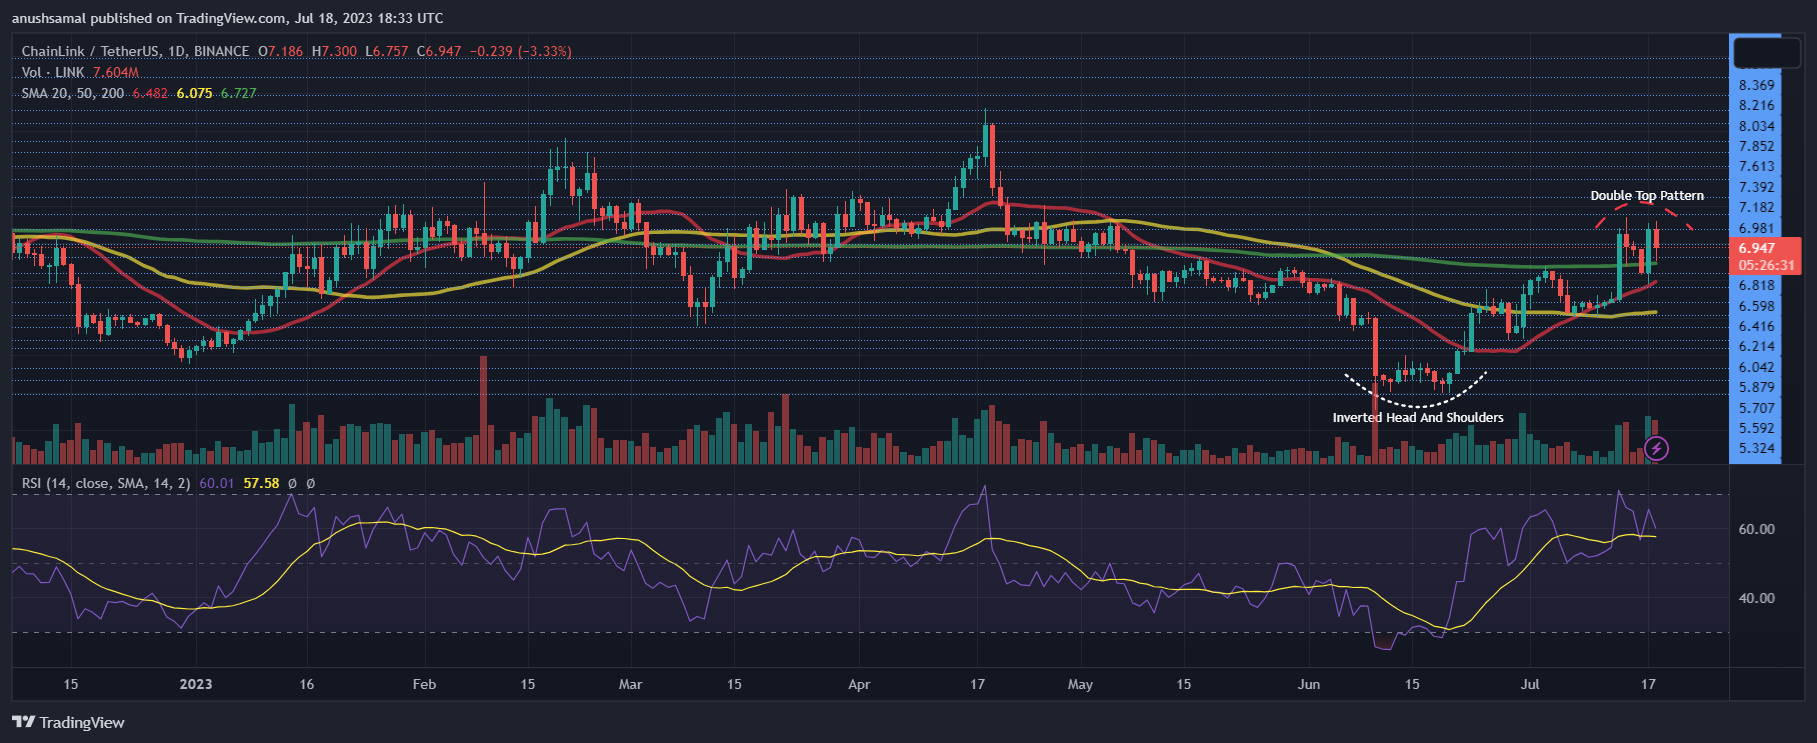
At the time of writing, Chainlink (LINK) was trading at $6.90. The coin has demonstrated significant bullish strength following its recent reversal from the $5 level, driven by the formation of an inverted head and shoulders pattern in the last week.
However, despite the upward surge, LINK may encounter resistance around the $7.30 mark, which has historically acted as a strong ceiling for the coin.
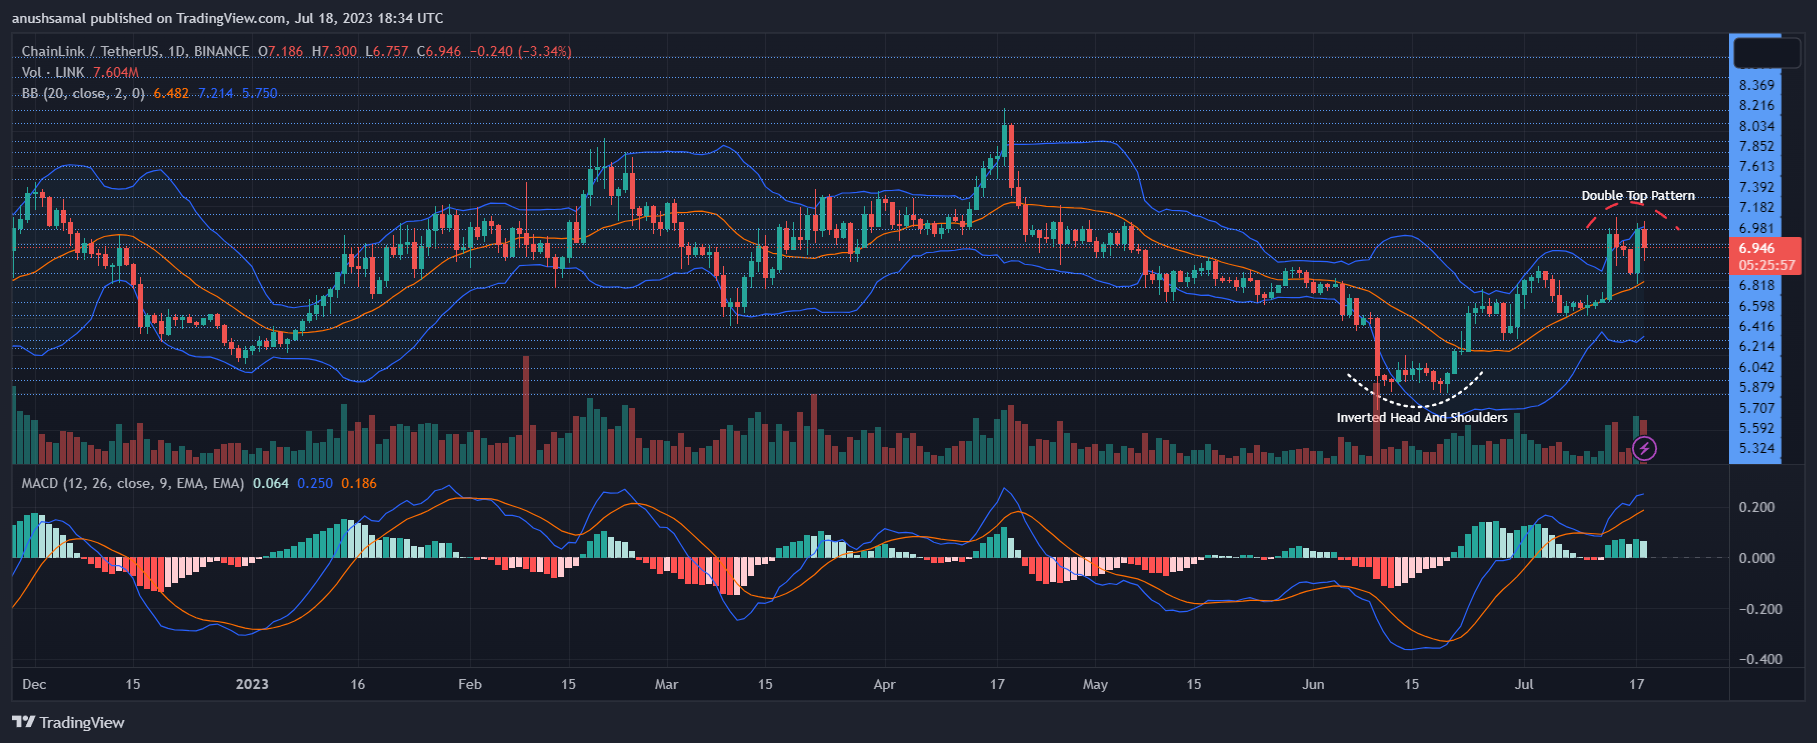
This resistance is further supported by the formation of a double-top pattern (marked in red), which is considered a bearish signal.
As a result, there is a possibility that LINK may experience a decline towards the local support level of $6.60 and potentially even further to $5.80 before attempting a recovery once again.
Technical Analysis

During the formation of the double-top pattern, there was a notable decline in buying strength, suggesting an impending bearish price movement. The Relative Strength Index (RSI) indicated a bearish divergence, indicating a decrease in demand.
Although the RSI remained above the half-line, readings indicated a fading buying strength. Despite this, LINK has managed to stay above the 20-Simple Moving Average (SMA) line, indicating that buyers still have control over price momentum.
However, if there is a drop from the current price level, it could lead to LINK falling below the 20-SMA (red), which could bring sellers back into the market.

On the one-day chart, the altcoin has exhibited buy signals, although these signals have been experiencing a slight decline.
The Moving Average Convergence Divergence (MACD) indicator, which reflects price momentum and trend reversals, has formed declining green histograms, suggesting a potential decrease in buy signals.
Additionally, the Bollinger Bands, which indicate volatility, are wide open, indicating the potential for significant price volatility in the upcoming trading sessions.
Featured image from UnSplash, charts from TradingView.com
Credit: Source link


