Today’s market session has kicked off with slight bull signals as the market cap now sits on a 0.4% gain within a day of trade as bulls look to control the markets again. The fear and greed index is currently neutral according to stats by CoinMarketCap.
Bitcoin (BTC) analysis
Bitcoin is having a slow day with mild bull activity as the asset trades 0.3% above its previous 24-hour price, and the weekly loss in valuation now reduces to 0.8% as of press time. BTC’s trading volume has dropped by 13% as activity on the network decreases.
However, Bitcoin’s volatility levels are low as the Bollinger bands maintain a small distance away from each other, indicating low volatility levels. The RSI indicator is also moving below its average line, showing the effort by bears to dominate ETH as the MACD indicator also moves in the negative region.
Ethereum (ETH) analysis
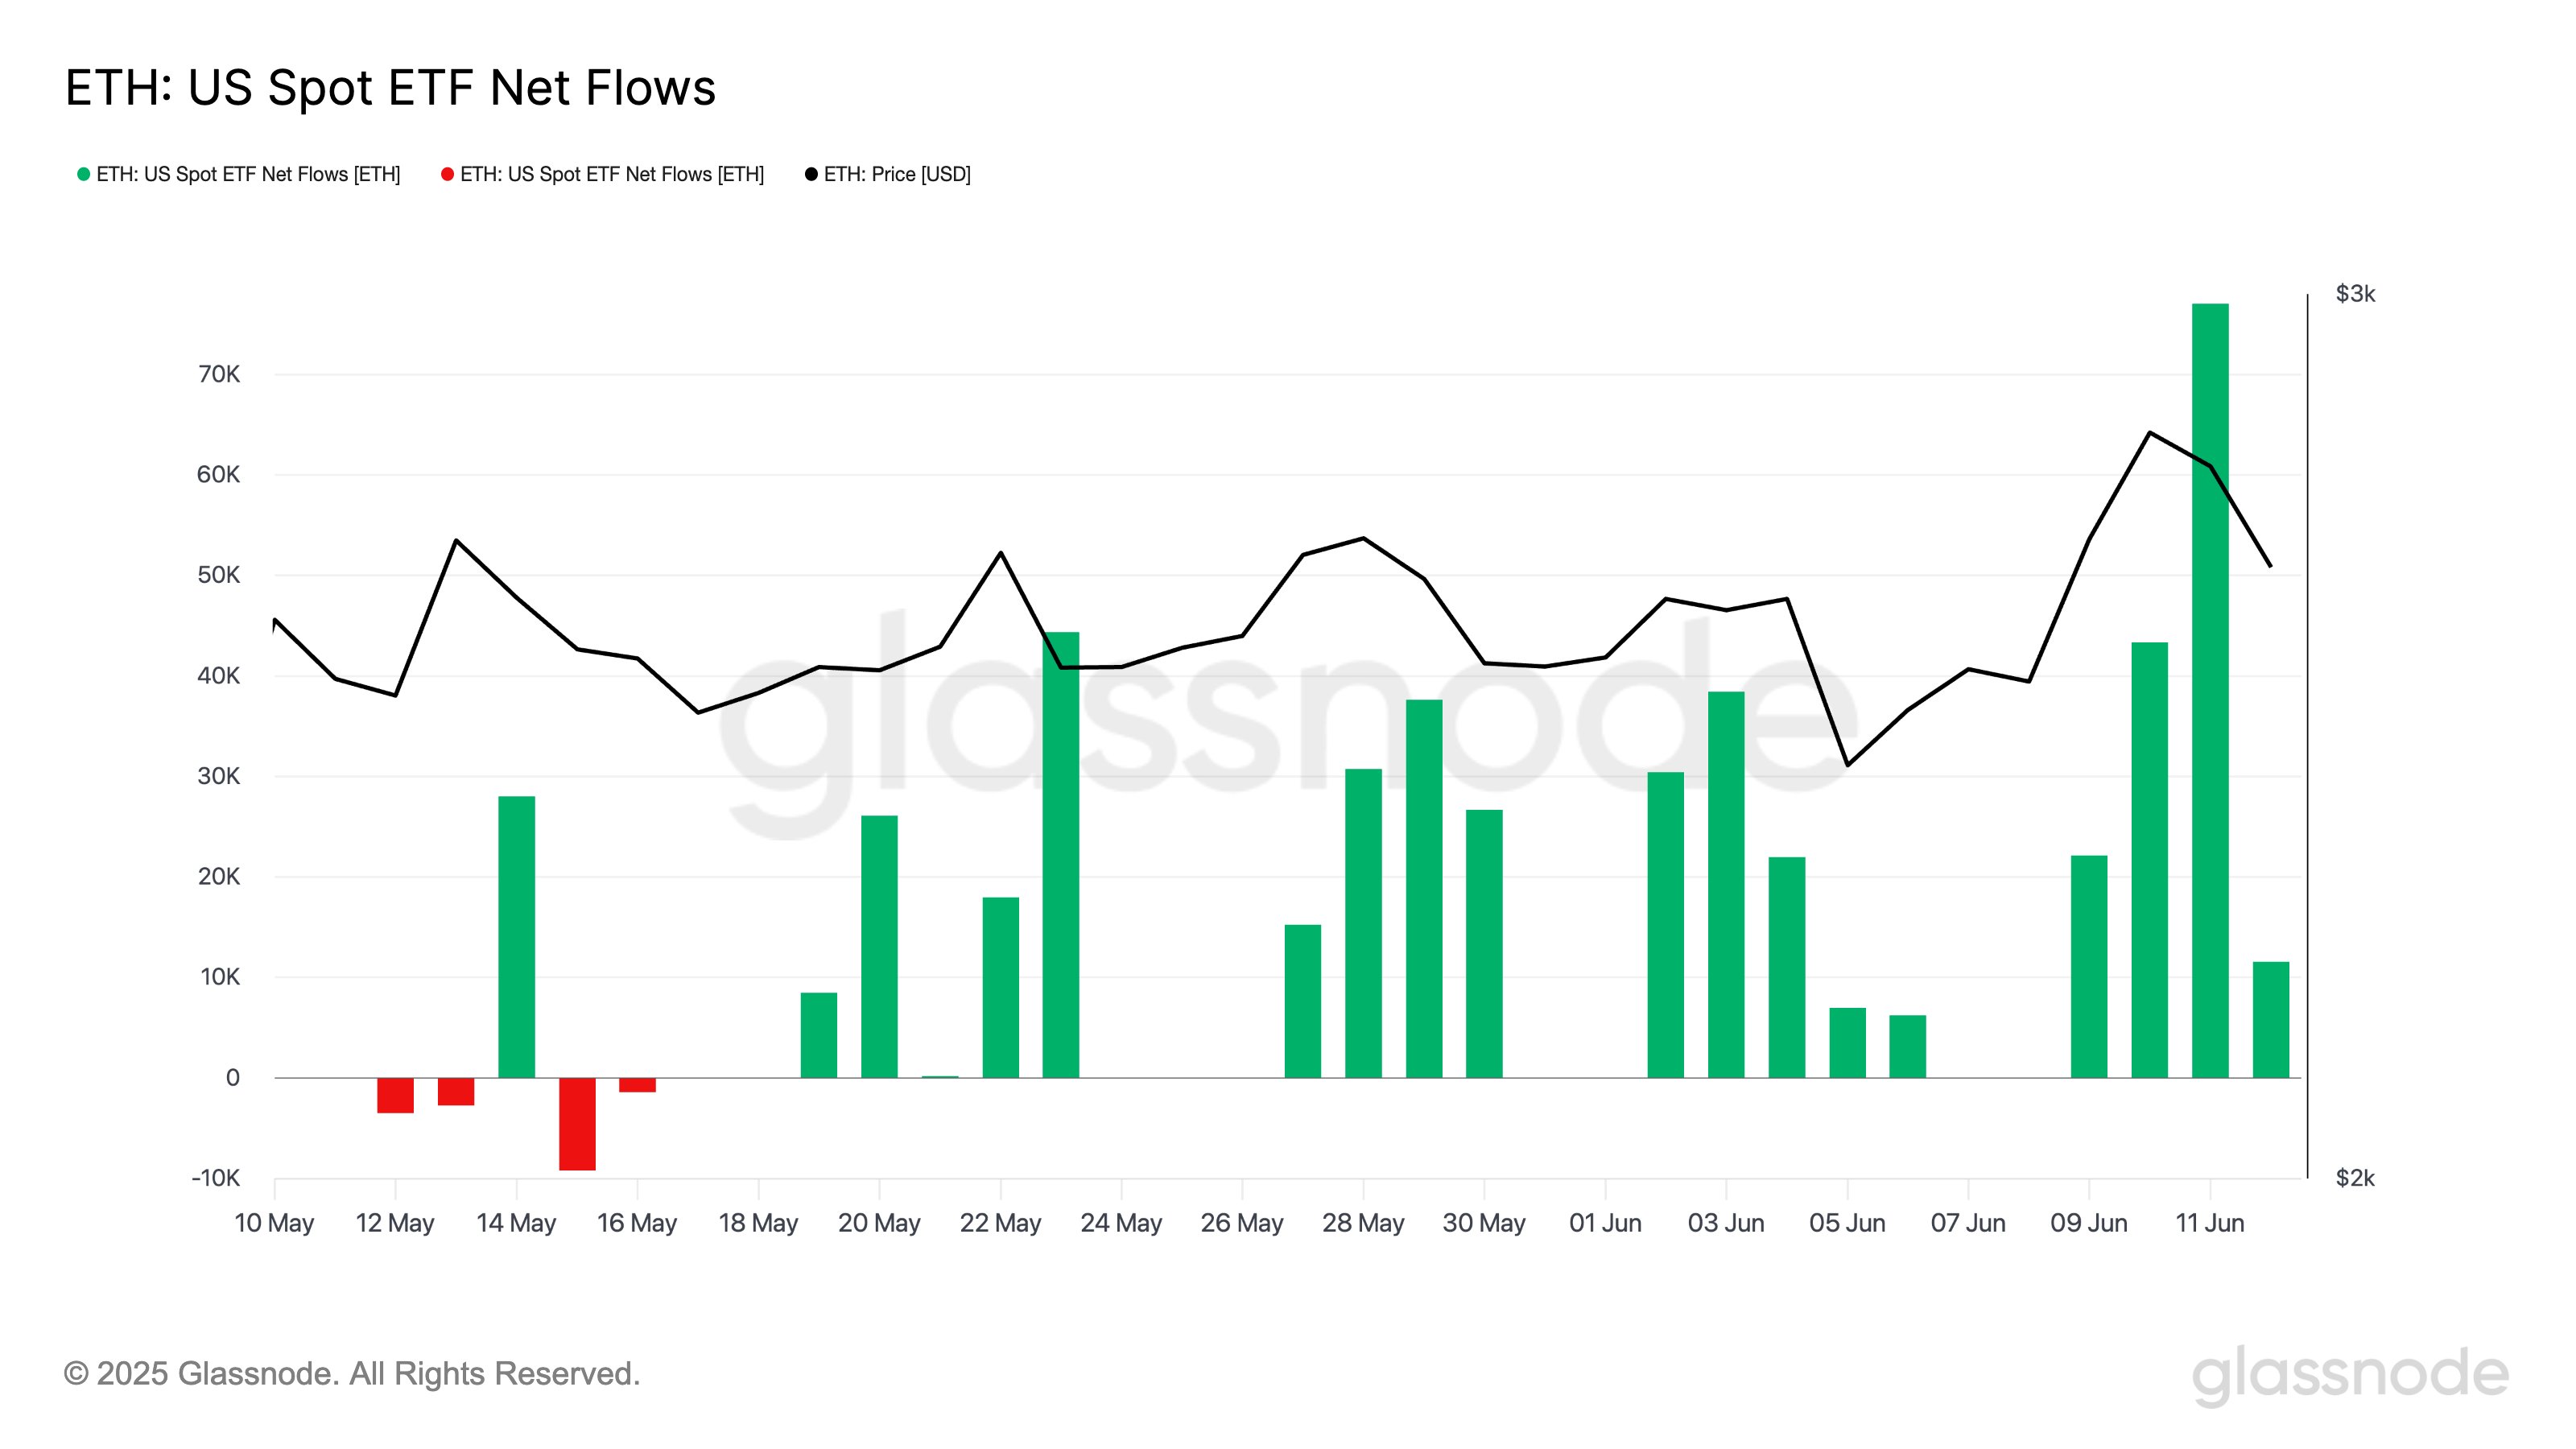
Ethereum also has a tremendous session as the asset trades 0.18% below its previous 24-hour price, as the asset’s weekly gain currently stands at 1.78%. ETH’s trading volume has seen a 6% rise within the same period to reach $6,307,075,283 as of press time.
Ethereum’s volatility levels are also rather stable as the Bollinger bands maintain a relatively closer distance away from each other as the RSI indicator also moves below its average line, indicating the effort by bears for dominance as the MACD indicator also moves in the negative region.
Ripple (XRP) analysis
XRP is also having a good session today as the asset trades 4.5% above its previous 24-hour price, as the weekly gain also stands at 74%, with the asset now selling at $0.812 and a trading volume of $3.6B representing a 7% increase as of press time.
Ripple’s volatility levels are still high as the Bollinger bands diverge from each other. At the same time, the RSI moves above its average line in the overbought region displaying the bull dominance on the asset’s network. The MACD indicator is also high in the positive region.
Solana (SOL) analysis
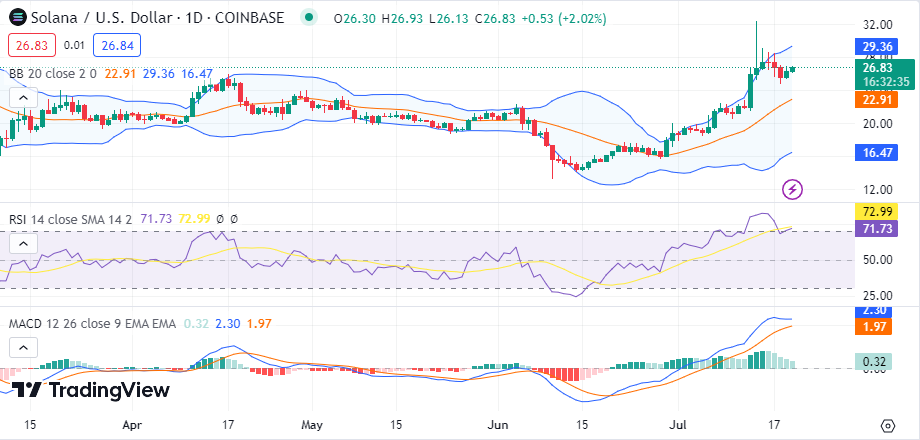
Solana is also making trends today and is 2% up from its previous 24-hour price as the asset trades 2% above its previous 24-hour price to trade at $28.6 as the weekly gain currently stands at 22%.
Solana’s volatility levels are also high as the Bollinger bands move far from each other while the RSI moves in the overbought region, again showing bull dominance. The MACD indicator is also in the positive region, again sowing bull dominance.

Other analysis
Stellar (XLM) also has a tremendous session as the asset, 21%. The weekly gain stands at 73% as the asset no trades at $0.1681. Optimism (OP) is another notable gainer today as the asset trades at $1.5688.
Credit: Source link


